Tyler Conklin + Maddy Sides
Concept
Smartphone-based GPS navigation makes it easy to move around a new city or navigate between cities. With turn-by-turn cues, blind or visually-impaired persons can navigate new spaces more independently than they may have been able to in the past. However, the resolution of iPhone/iPad-based GPS is estimated at about 10 meters. This resolution is useful to find buildings or roads, but is not reliable enough once the user is inside a building or building complex. The higher accuracy of location provided by WiFi networks offered in a building or building complex could be put to use in helping this user group to independently find a certain room or meeting place.
In this project, we demonstrate that position data collected from WiFi can be used to help a user independently navigate the hallways and rooms of a complicated building environment. We demonstrate the core functionality of such a product by navigating a scaled 60cm x 90cm map of the Packard Building basement.
Setup
Hardware
The hardware used to generate and transmit the position data was the combination of the IMU sensor board developed in EE107 and the Microsoft Hololens. The devices were rigidly connected to be used as one unit for improved location tracking. The IMU sensor board is a combination of the Arduino Pro Mini and Adafruit BNO055 IMU sensor with added components for USB communication. The Adafruit BNO055 IMU sensor information is combined with CSI (Channel State Information) from the WiFi packets to give a position estimate with accuracy to a few millimeters. This is more than enough for the real world, and more than enough for our scaled model.
The Map
The map we chose to create represented the Packard Building basement. We chose important locations in the basement to represent on the map that users would want to visit while down in the basement like the emergency exit, bathrooms, and classrooms/labs. The 60cm x 90cm map of the area to navigate was created with Adobe Illustrator. From this visual map, we created a text file that contained relevant information like location coordinates in centimeters and connections between map nodes to find the shortest path between destinations with our program. The format of this file will be described in the Software section of our blog post. The map is shown here.
This version of the map shows the node numbers we used to describe the basement. These node numbers were not on the final version that we printed for our demonstration, but they will be useful in describing the software used in our project.
Software (data-processing chain)
The first step in the software processing chain is to initialize the graph representing the room or building. This graph is represented in a text file with the below format:
# of Nodes
NAMES
Name:Node number
…
NODES
Node number:X:Y
…
EDGES
Src node: dest node
…
This provides all the necessary information to direct our user through the building or room. We use our weightedGraph class to represent the building in software. Our java application consists of three classes (route.java, weightedGraph.java, and the main class that tracks the user).
After the graph is set up, the next step is to prompt the user for his or her intended destination. After receiving the destination, the application connects to the server. The server responds with a port number to listen to in order to receive the position data. Once this is done, the application initializes the point at which the user is at to (0,0). This is why it is important to place the user at the entrance when the application is started. The route that the user will take is also initialized at this point in time. This is done in one loop. Each time through this loop, position data is received from the server. So ensuing loops guide the user to his or her intended destination. We do not print instructions every time through the loop, or the user would quickly be overwhelmed.
The navigation is done by using the route initialized when the user first enters his or her intended destination. The intended destination is converted to a node number, then Dijsktra’s algorithm is run to find the shortest path between the start and destination nodes. We keep track of the path by using our Route class. This class adds a thin abstraction layer to an arrayList of integers representing which nodes to guide the user to. The user is then guided to the next node in the route until he or she reaches that node. If that node is the final node, then the user has arrived, if it is not, then navigation continues to the next node. The output (printed slightly faster than once a second) looks something like this:
Go 12.520714904785157 cm in the EAST
Cardinal directions are used. This is a place for further improvement. The quaternion data sent by the server could be utilized to give the user more natural directions (left or right). Another area for further development is ‘smarter’ navigation. Since you are navigating from node to node, it possible to receive an instruction such as, “Go 12.520714904785157 cm in the EAST”, then travel 12 cm to the East, only to receive another instruction to go farther east since the next node is also to the east.
After the user reaches the final destination, he or she is prompted for the next intended destination. The user can move around freely, until he or she has another intended destination. That is to say that the route is initialized not from the last node the user was at, but at the current location of the user.
Testing and Findings
The software will be described in the order in which is was developed, since the core functionality came first, and only later were surrounding layers added. Testing was done incrementally, doing our best to test tiny details one by one so that we could catch bugs early, before they were integrated into the larger software. The first task was to receive the position data from the server. Example C code was given, but since we were writing our application in java, this client code had to be translated to java. This was more difficult than originally expected due to java’s lack of support for working with underlying bit representation of data. For instance java has no unsigned integer type. This was the first step, because in the case this didn’t work, then we would not be able to write our application in java. So it was pointless to start on other java code without this. However, we were able to receive the port number to listen to, then connect to this port number for the position data. This was tested by using the emulator to send over the same deterministic data, which we printed from our java application and our C client code and ensured they gave the same data.
The next portion to verify was translating the text file to our weightedGraph class. This was done using the printGraph function in our weightedGraph class, we simply printed off the graph and compared to our text file, and our PDF of our representation of the Packard basement.
The rest of the weightedGraph class had to be tested too, especially the route finding. To do this, we simply looped through all possible source and destination nodes, and found routes between them, verifying that they were indeed the shortest routes. A sample of this testing output is shown below:
0 -> 0
Cost: 0.0
…
0 -> 14 -> 15 -> 5
Cost: 67.63400544912666
0 -> 14 -> 15 -> 5 -> 6
Cost: 90.27800544912667
0 -> 14 -> 15 -> 5 -> 6 -> 7
Cost: 104.16000544912666
0 -> 13 -> 12 -> 11 -> 10 -> 9 -> 8
Cost: 89.924
0 -> 13 -> 12 -> 11 -> 10 -> 9
Cost: 81.036
0 -> 13 -> 12 -> 11 -> 10
Cost: 67.28
…
5 -> 6 -> 7 -> 8
Cost: 69.116
5 -> 15 -> 16 -> 10 -> 9
Cost: 60.228
5 -> 15 -> 16 -> 10
Cost: 46.472
5 -> 15 -> 16 -> 10 -> 11
Cost: 68.759
…
Now it was time to integrate the entire system. Great care must be taken in initializing the Hololens and position tracking system. The IMU sensor board is attached to the top of the Hololens as shown in the picture below.
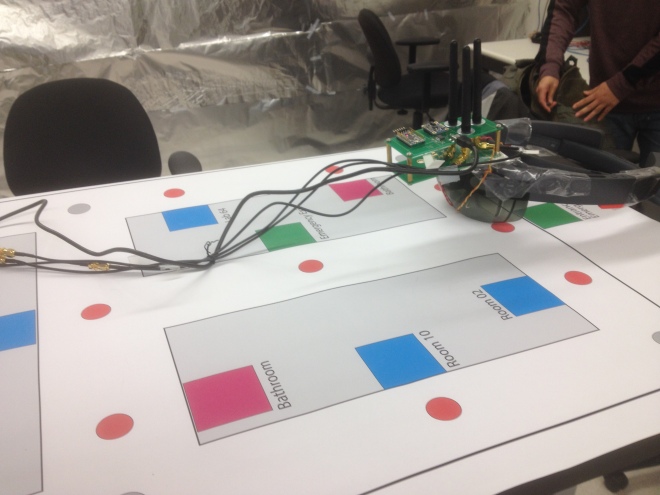
You can also see our poster laid out on the table. Notice that the position tracking system starts at the entrance to the “room”. We chose the edge of the left lens of the Hololens to represent the user. The BNO055 on the sensor board and the Hololens must be carefully arranged in accordance with the X,Y axes of the poster. Once this is done, you must start the origami app in the Hololens and the begin_tx executable on the NUC together. This will begin the data transmission. After doing this we opened up our java application and commented out much of the relevant code, only printing off the (X,Y) location of the “user”. We then checked various nodes to ensure that the position tracking gave correct coordinates for the nodes. At first the coordinates were not even close, this is how we learned how important aligning the axes is.
With the position tracking giving correct coordinates, we tested the entire system, printing off as much information as possible (the destination, route, current position of the user, directions to get to the next node). We tested various destinations, and let the application run for a while, then continued. Everything seemed to work really well. Note that if your axes are slightly off, you will begin to notice errors for the nodes farthest away from (0,0).
Challenges
During initial testing with the Hololens and sensor board combination, we learned the importance of correct initial orientation with respect to the map axes. During the initialization step of the program, it is important to orient the sensor board to be square with respect to the X and Y axes of the map so that the coordinate system of the sensor board is aligned with the coordinate system used to describe the map in our program. This impacts reaching the farthest nodes from (0,0) when the small error can accumulate.
Another challenge is the “speed” of the user. Of course we are ‘digitally’ sampling an analog value, the user’s position. So if the user moves much faster than we are sampling, then we are going to miss locations that the user takes. This can lead to errors in the navigation. But if the Hololens/sensor board moves at the approximate speed a human would cover going through the Packard basement, then no issues occur. This is what we are simulating after all.
Conclusions
Our proof-of-concept system proved successful! The WiFi position tracking provides great accuracy indoors. Often times, if a blind user wants to access a new building, he or she must be shown around to know where certain facilities are (entrance/exit, bathroom, etc…). With this proof-of-concept, it was shown that it would be possible to describe buildings/rooms as graphs. These graphs could for instance automatically be downloaded by a mobile device upon entering a building. An application on the mobile device could guide the user to a desired location without the user having any previous knowledge or experience with the building.
P.S. A big thank you to the EE107 teaching team (Mani, Joseph, Alex, and Pengyu). We can hardly recall a time we were in lab without at least one member of the teaching staff there to provide help if we were stuck at any point. Also this was a very fun project to work on. Please contact tconklin at stanford dot edu or msides at stanford dot edu with any questions!
